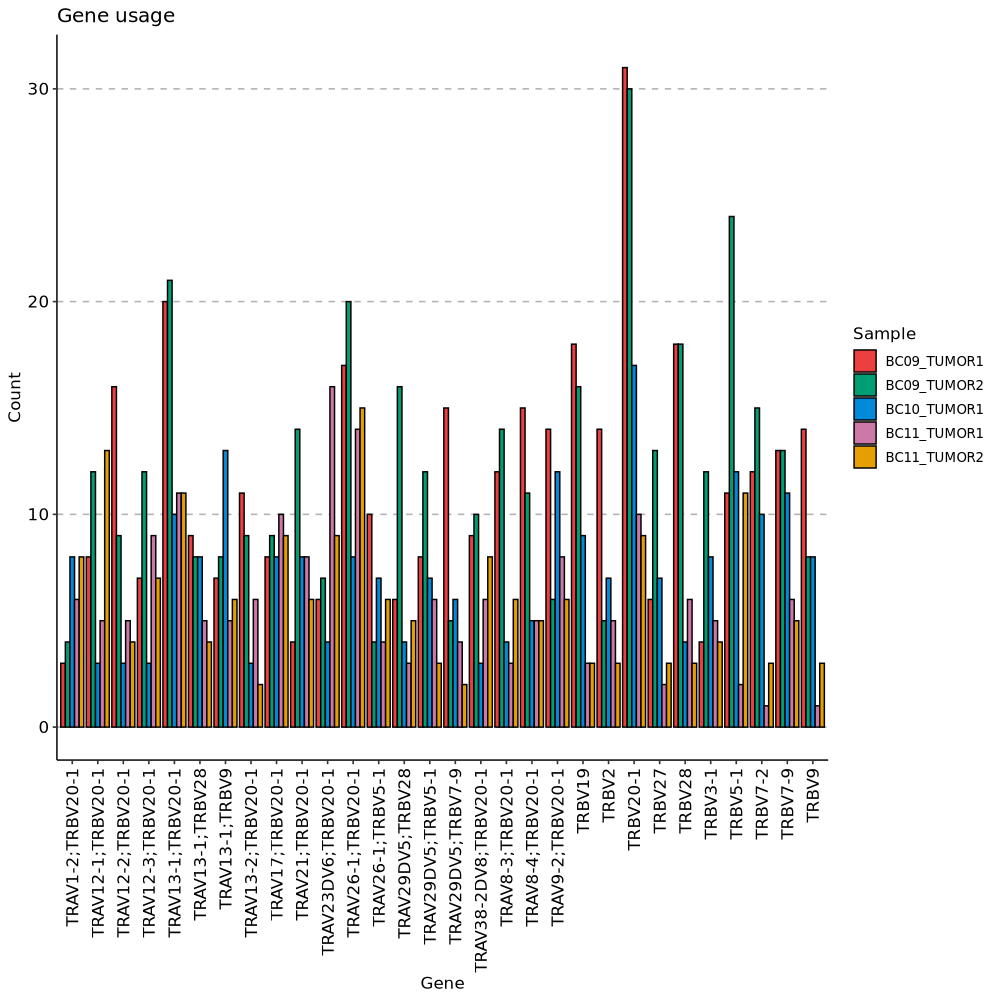
Gene Usage
Distribution of known gene segments following the IMGT nomenclature.
Image loading error!
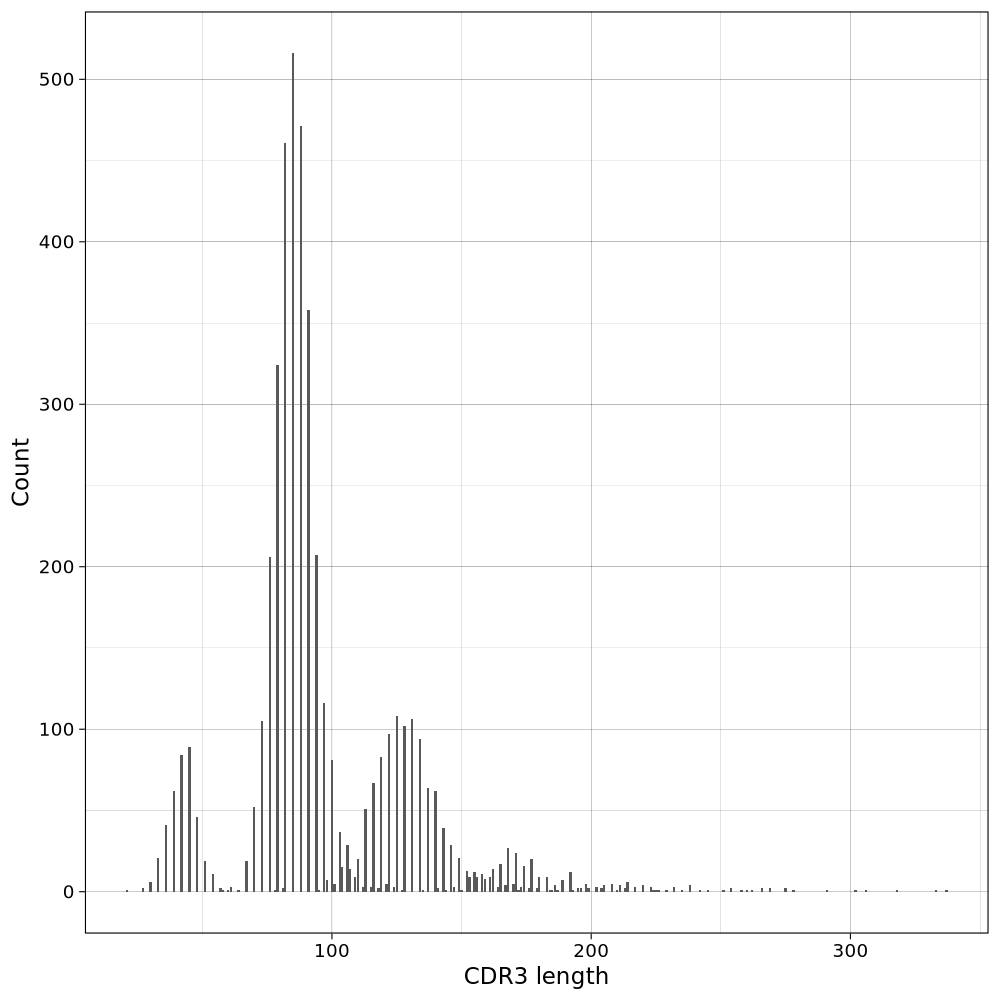
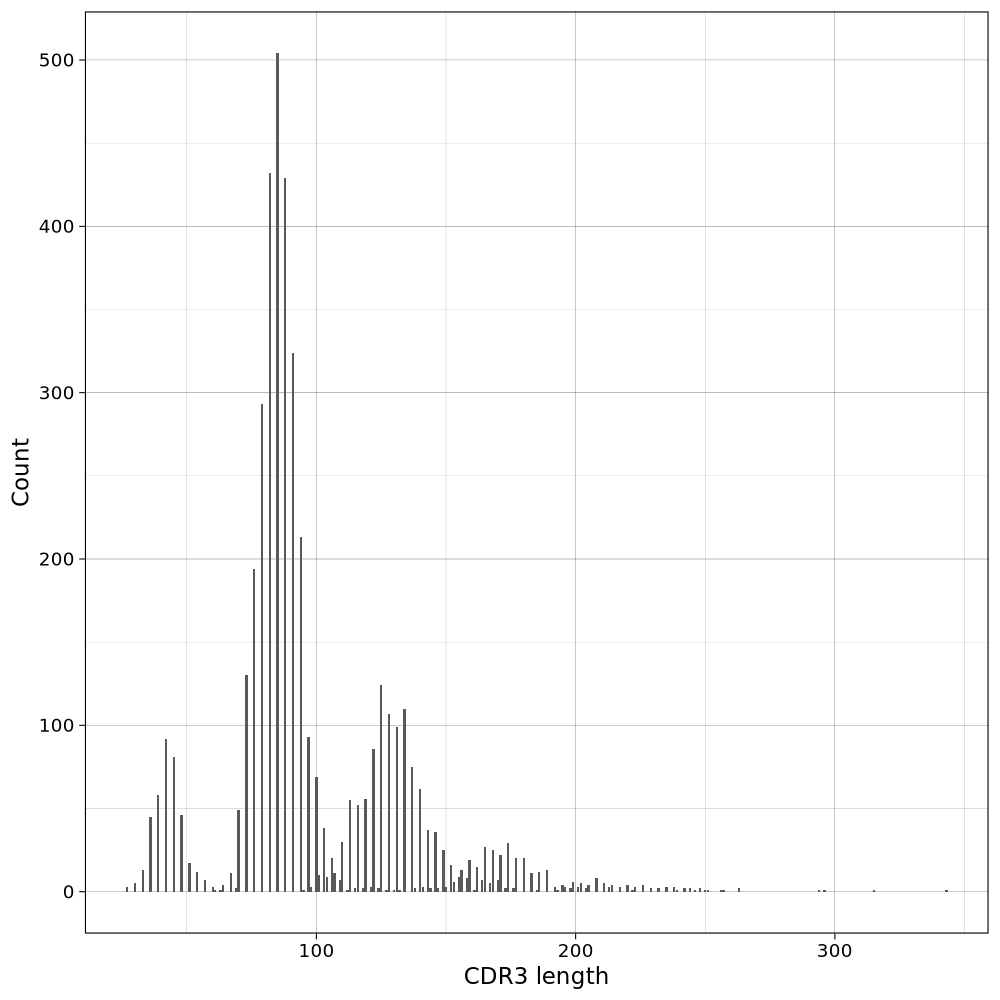
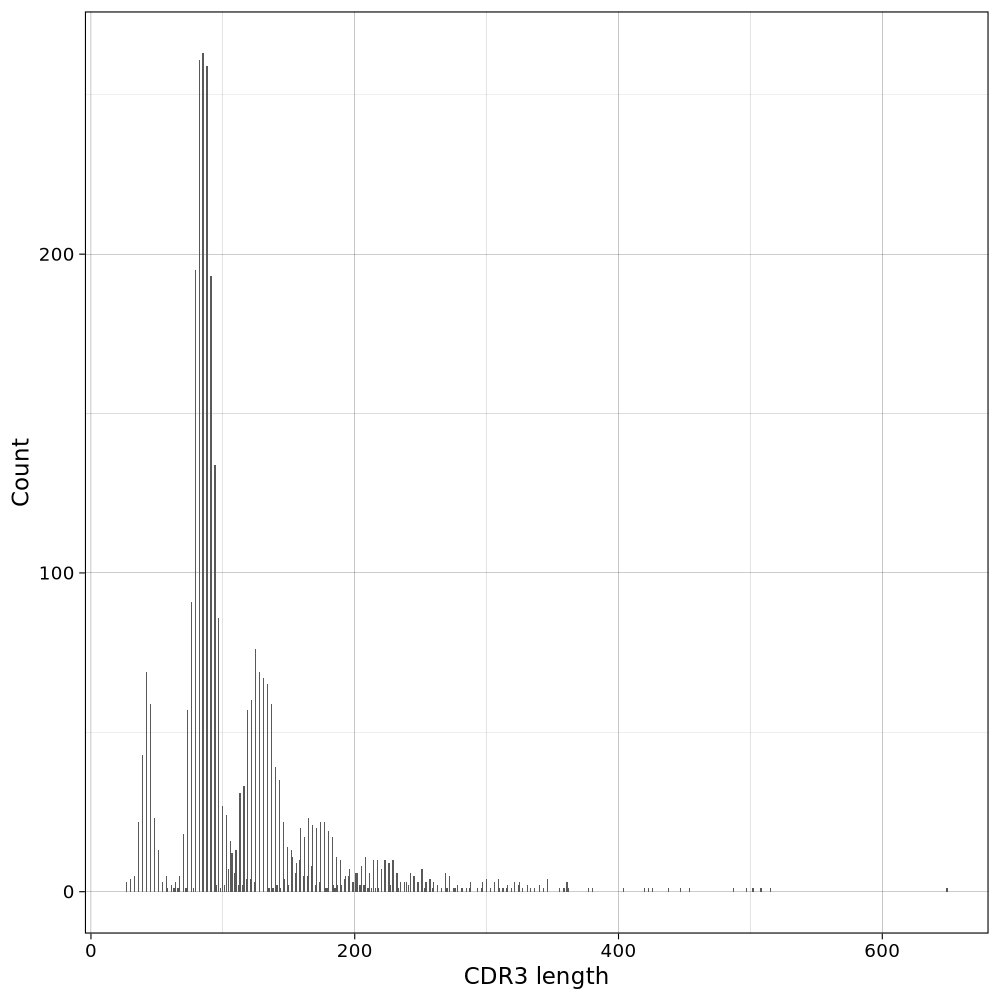
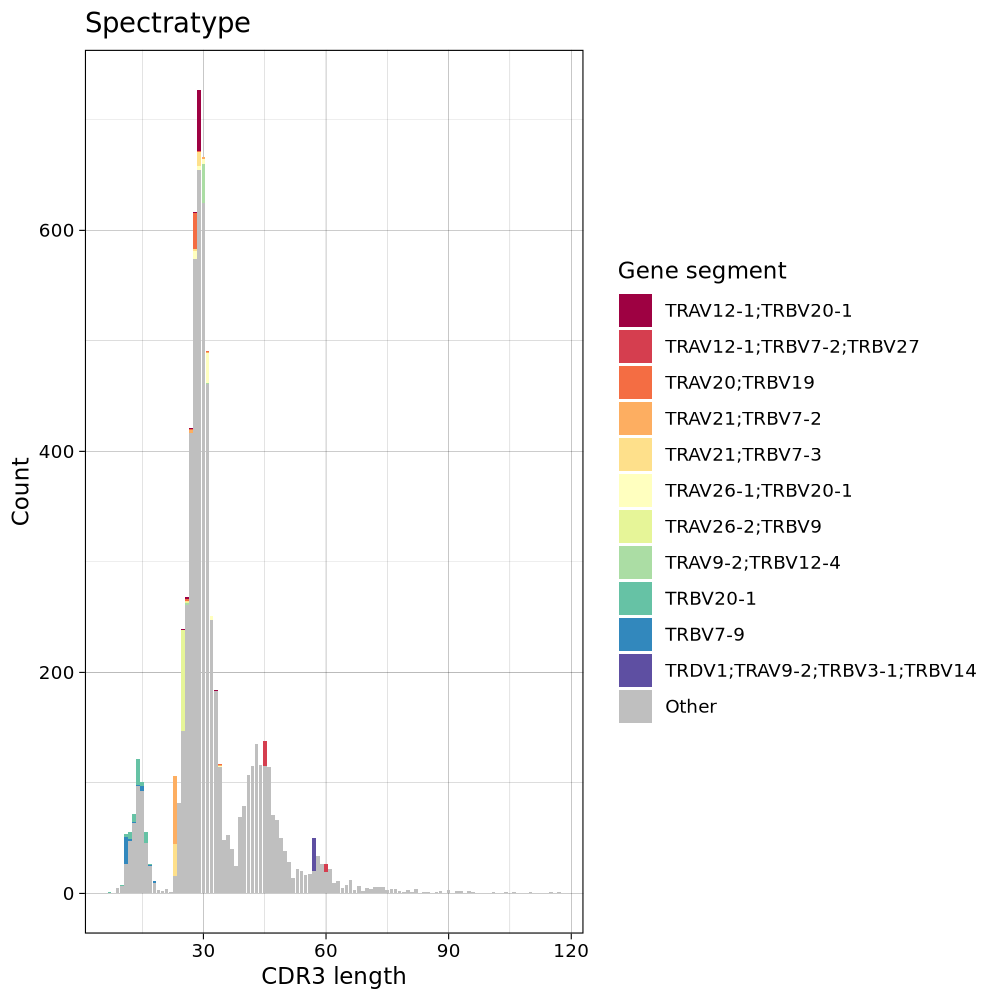
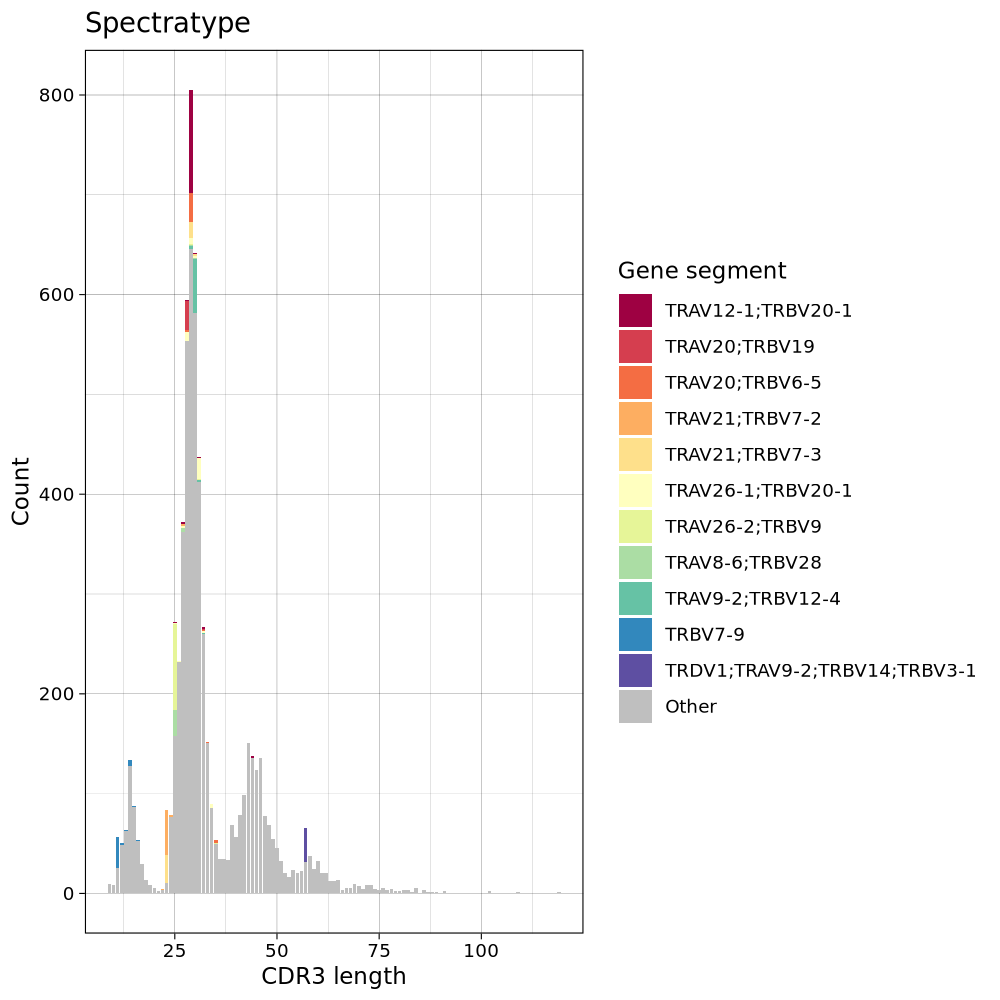
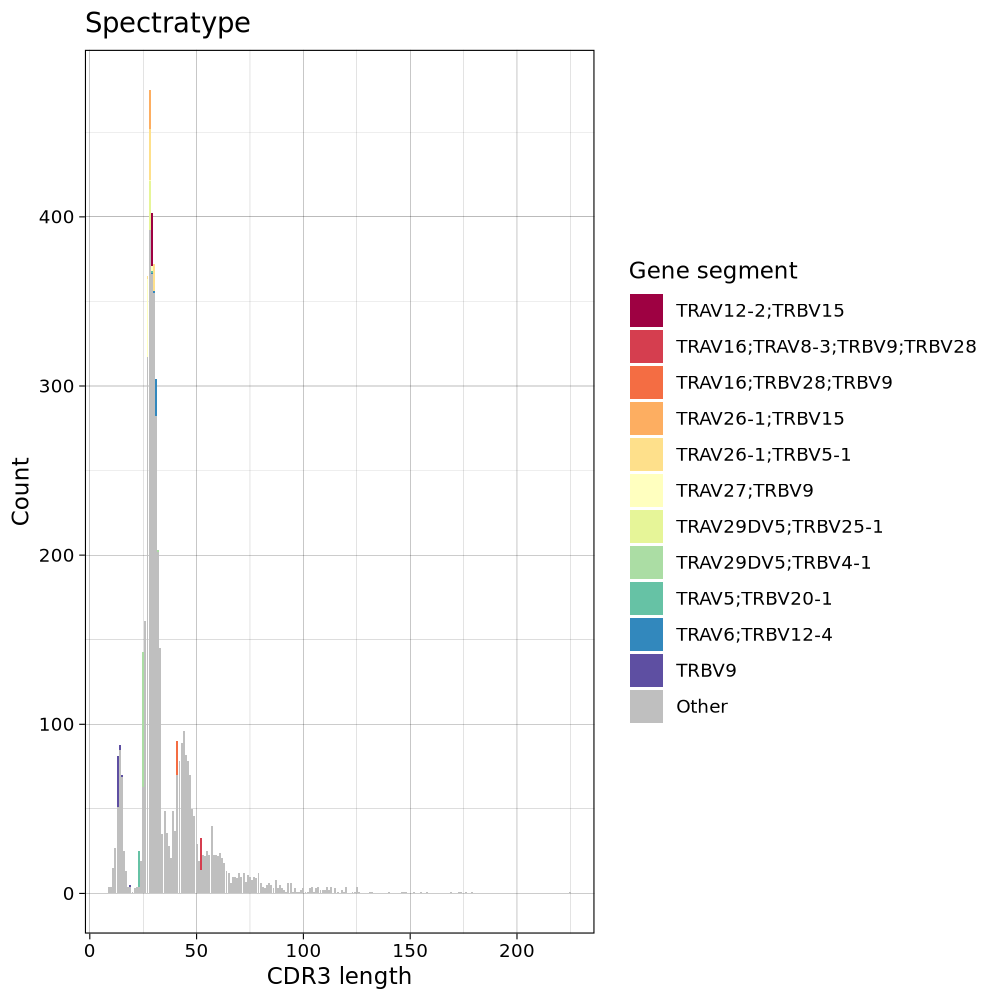
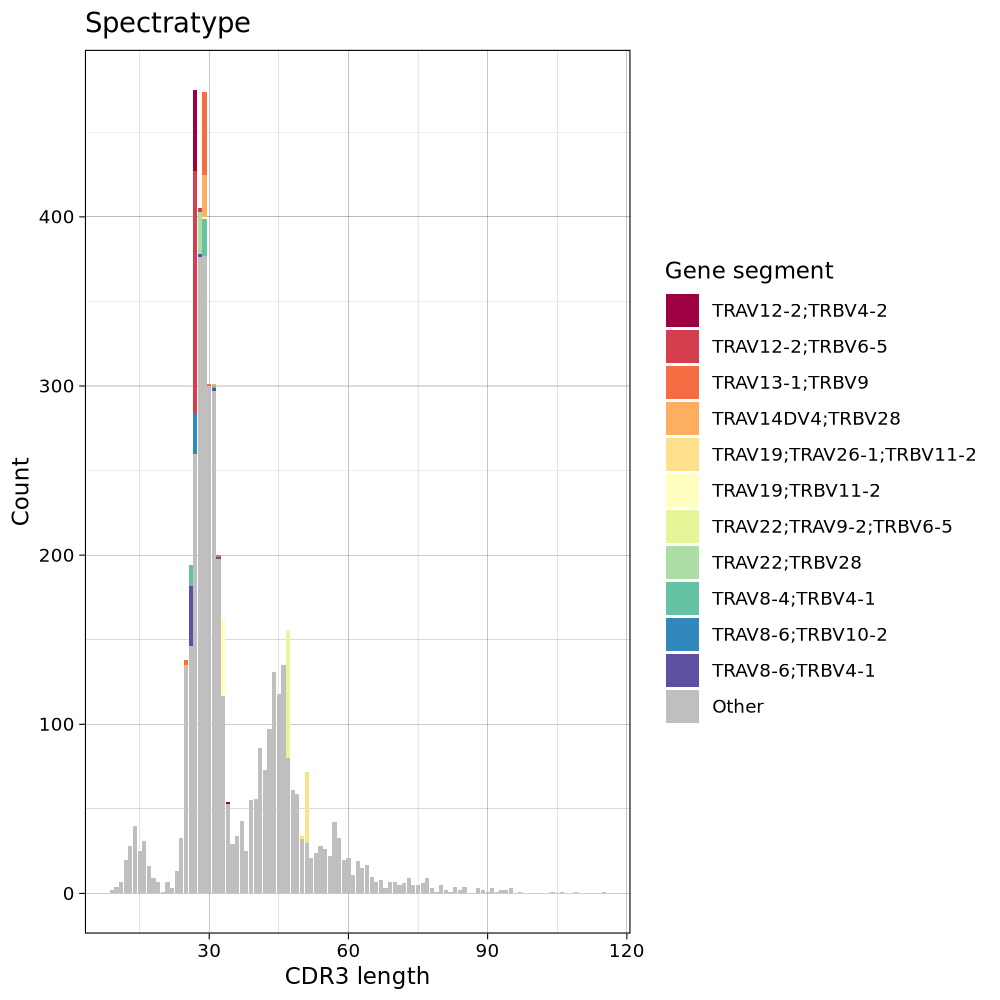
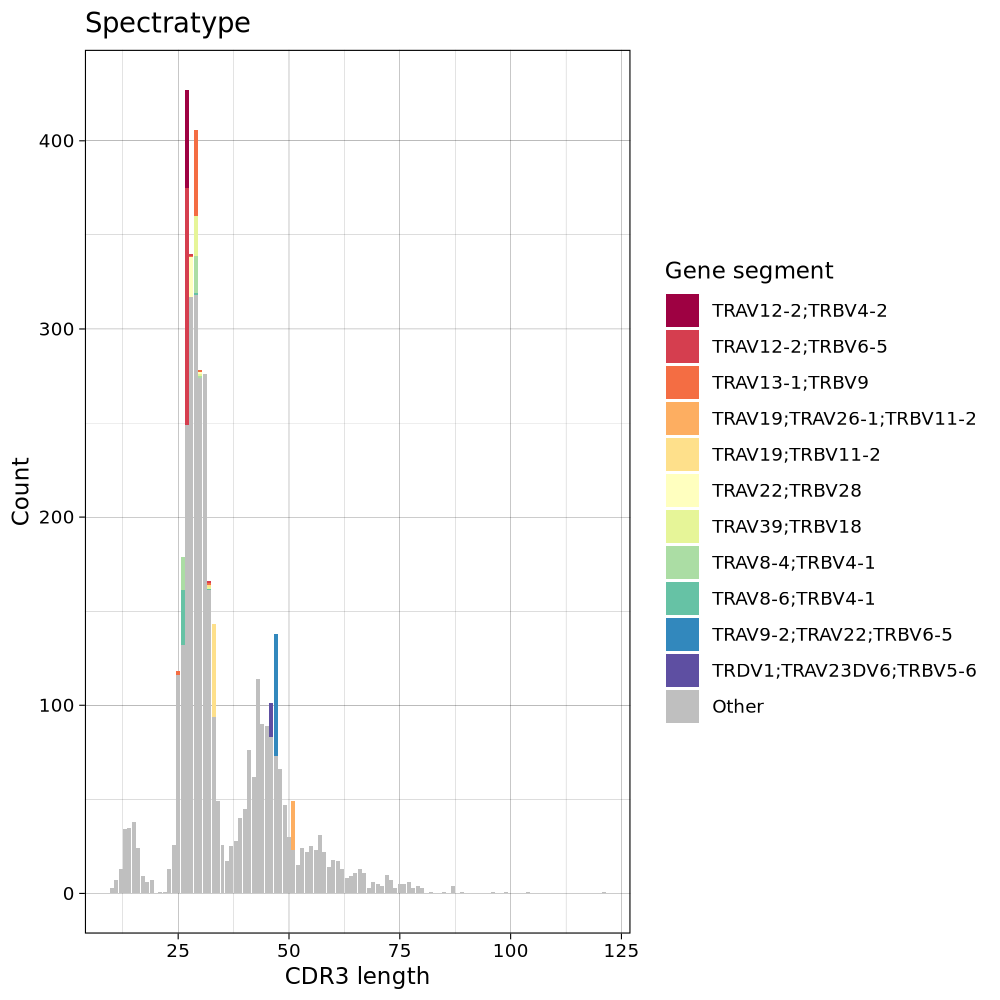
Spectratyping
Spectratype is a useful way to represent distributions of genes per sequence length.
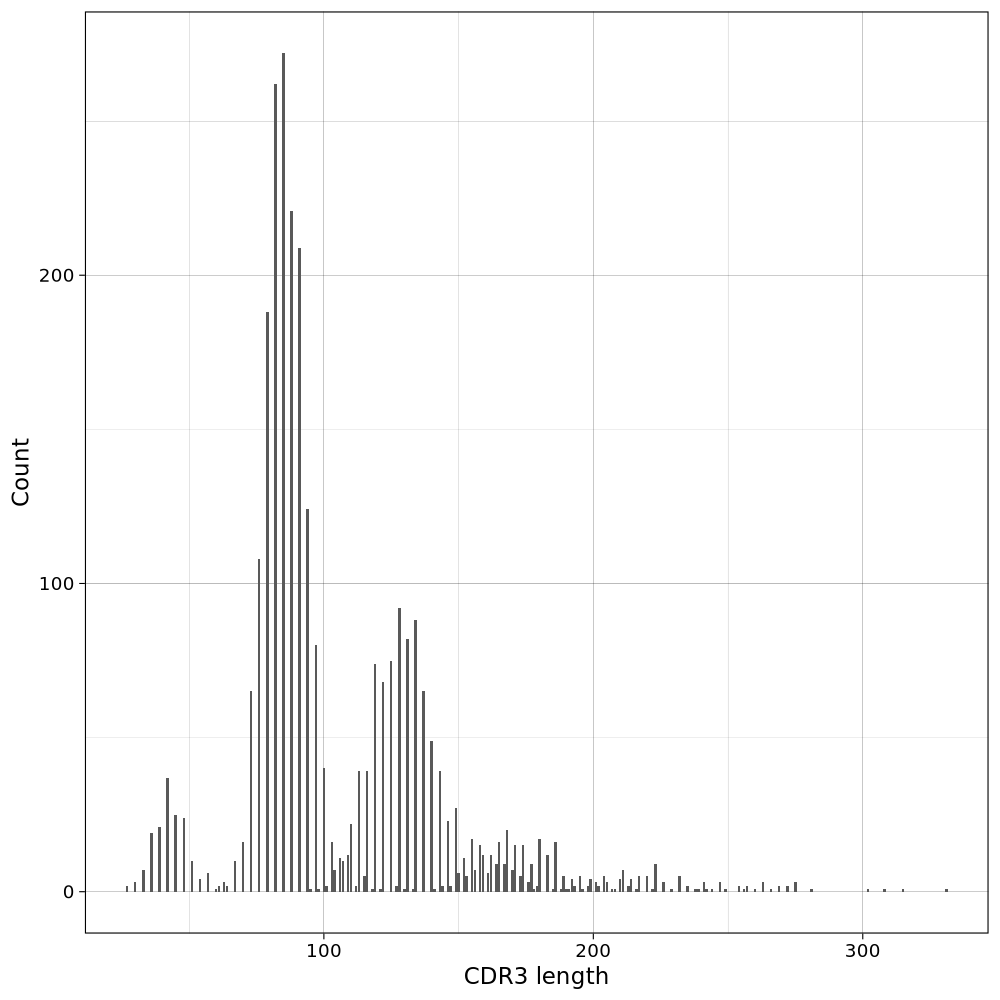
By_Clonotype
BC09_TUMOR1
Image loading error!
BC09_TUMOR2
Image loading error!
BC10_TUMOR1
Image loading error!
BC11_TUMOR1
Image loading error!
BC11_TUMOR2
Image loading error!
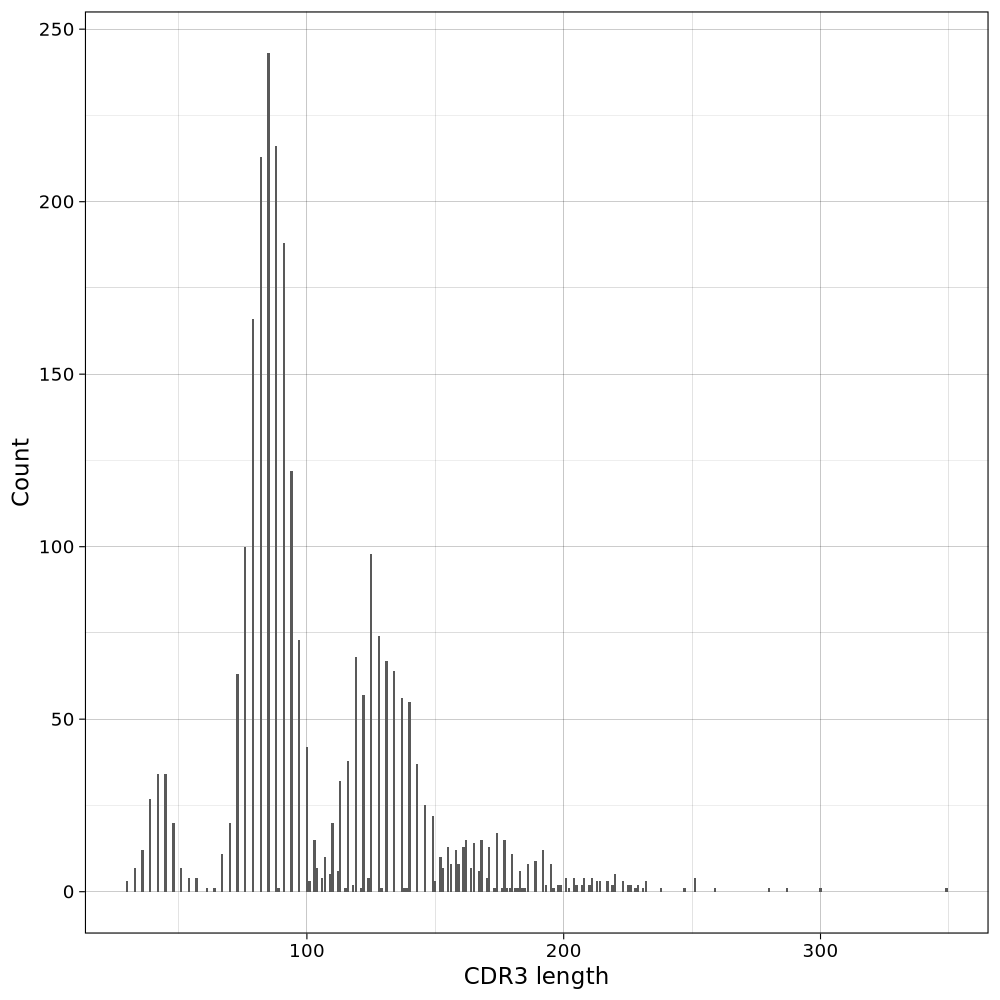
By_Num_Clones
BC09_TUMOR1
Image loading error!
BC09_TUMOR2
Image loading error!
BC10_TUMOR1
Image loading error!
BC11_TUMOR1
Image loading error!
BC11_TUMOR2
Image loading error!
Diversity Estimation
gini
Diversity estimation using
gini: the Gini coefficient measures the inequality among values of a frequency distribution (for example levels of income). A Gini coefficient of zero expresses perfect equality, where all values are the same (for example, where everyone has the same income). A Gini coefficient of one (or 100 percents ) expresses maximal inequality among values (for example where only one person has all the income).Image loading error!
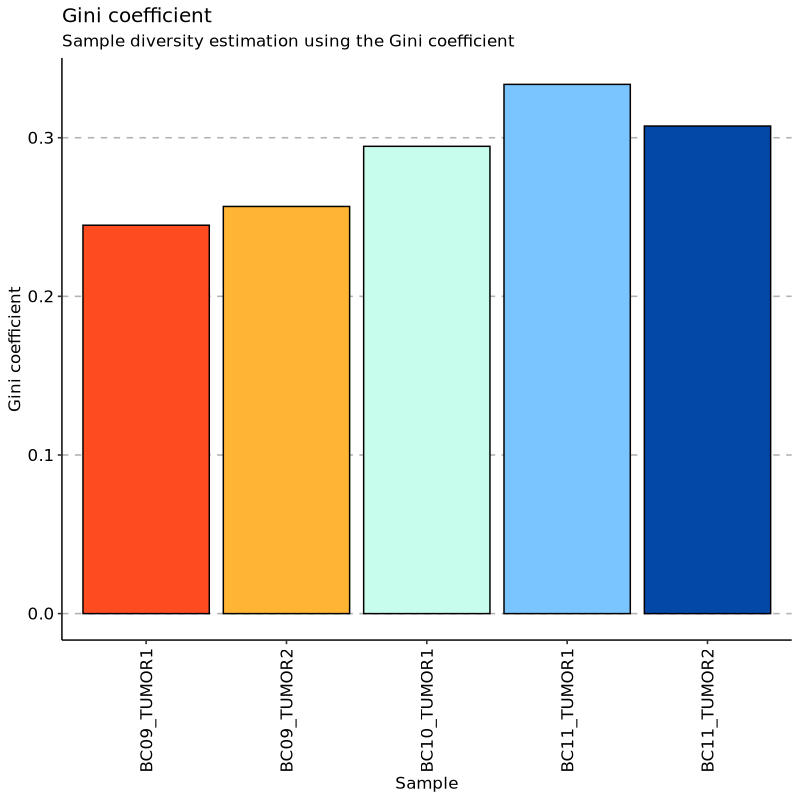
| BC09_TUMOR1 | 0.2448 |
| BC09_TUMOR2 | 0.2567 |
| BC10_TUMOR1 | 0.2946 |
| BC11_TUMOR1 | 0.3336 |
| BC11_TUMOR2 | 0.3074 |
Downloading entire data
You must use "Save as" or "Save link as" from the context menu (by right-clicking the button) to download the entire data.
Running Information
Showing the first job only. Check the workdir for information of other jobs if any.
# Generated by pipen_runinfo v0.5.0
# Lang: R
R version 4.2.0 (2022-04-22)
Platform: x86_64-conda-linux-gnu (64-bit)
Running under: Debian GNU/Linux 11 (bullseye)

Matrix products: default
BLAS/LAPACK: /opt/conda/lib/libopenblasp-r0.3.25.so

locale:
 [1] LC_CTYPE=C.UTF-8       LC_NUMERIC=C           LC_TIME=C.UTF-8
 [4] LC_COLLATE=C.UTF-8     LC_MONETARY=C.UTF-8    LC_MESSAGES=C.UTF-8
 [7] LC_PAPER=C.UTF-8       LC_NAME=C              LC_ADDRESS=C
[10] LC_TELEPHONE=C         LC_MEASUREMENT=C.UTF-8 LC_IDENTIFICATION=C

attached base packages:
[1] stats     graphics  grDevices utils     datasets  methods   base

other attached packages:
 [1] circlize_0.4.15    tibble_3.2.1       glue_1.7.0         ggprism_1.0.4
 [5] immunarch_0.9.0    patchwork_1.2.0    data.table_1.14.10 dtplyr_1.3.1
 [9] ggplot2_3.4.4      tidyr_1.3.0        dplyr_1.1.4        rlang_1.1.3
[13] jsonlite_1.8.8     logger_0.2.2

loaded via a namespace (and not attached):
  [1] readxl_1.4.3           uuid_1.2-0             backports_1.4.1
  [4] spam_2.10-0            fastmatch_1.1-4        plyr_1.8.9
  [7] igraph_1.6.0           lazyeval_0.2.2         sp_2.1-2
 [10] splines_4.2.0          RcppHNSW_0.5.0         listenv_0.9.0
 [13] scattermore_1.2        digest_0.6.34          foreach_1.5.2
 [16] htmltools_0.5.7        viridis_0.6.4          ggalluvial_0.12.5
 [19] fansi_1.0.6            magrittr_2.0.3         tensor_1.5
 [22] cluster_2.1.6          doParallel_1.0.17      ROCR_1.0-11
 [25] tzdb_0.4.0             globals_0.16.2         readr_2.1.5
 [28] graphlayouts_1.0.2     matrixStats_1.1.0      spatstat.sparse_3.0-3
 [31] colorspace_2.1-0       ggrepel_0.9.5          spatstat.data_3.0-4
 [34] progressr_0.14.0       zoo_1.8-12             survival_3.5-7
 [37] phangorn_2.11.1        iterators_1.0.14       ape_5.7-1
 [40] polyclip_1.10-6        gtable_0.3.4           UpSetR_1.4.0
 [43] leiden_0.4.3.1         car_3.1-2              kernlab_0.9-32
 [46] future.apply_1.11.1    shape_1.4.6            prabclus_2.3-3
 [49] DEoptimR_1.1-3         abind_1.4-5            scales_1.3.0
 [52] pheatmap_1.0.12        spatstat.random_3.2-2  rstatix_0.7.2
 [55] miniUI_0.1.1.1         Rcpp_1.0.12            viridisLite_0.4.2
 [58] xtable_1.8-4           reticulate_1.34.0      mclust_6.0.1
 [61] dotCall64_1.1-1        stats4_4.2.0           htmlwidgets_1.6.4
 [64] httr_1.4.7             RColorBrewer_1.1-3     fpc_2.2-11
 [67] modeltools_0.2-23      ellipsis_0.3.2         Seurat_5.0.1
 [70] factoextra_1.0.7       ica_1.0-3              pkgconfig_2.0.3
 [73] flexmix_2.3-19         farver_2.1.1           uwot_0.1.16
 [76] deldir_2.0-2           nnet_7.3-19            ggseqlogo_0.1
 [79] utf8_1.2.4             labeling_0.4.3         tidyselect_1.2.0
 [82] reshape2_1.4.4         later_1.3.2            munsell_0.5.0
 [85] cellranger_1.1.0       tools_4.2.0            cli_3.6.2
 [88] generics_0.1.3         broom_1.0.5            ggridges_0.5.5
 [91] stringr_1.5.1          fastmap_1.1.1          goftest_1.2-3
 [94] fitdistrplus_1.1-11    tidygraph_1.3.0        robustbase_0.99-1
 [97] purrr_1.0.2            RANN_2.6.1             ggraph_2.1.0
[100] pbapply_1.7-2          future_1.33.1          nlme_3.1-164
[103] mime_0.12              compiler_4.2.0         shinythemes_1.2.0
[106] plotly_4.10.4          png_0.1-8              ggsignif_0.6.4
[109] spatstat.utils_3.0-4   tweenr_2.0.2           stringi_1.7.12
[112] RSpectra_0.16-1        lattice_0.22-5         Matrix_1.6-5
[115] vctrs_0.6.5            stringdist_0.9.10      pillar_1.9.0
[118] lifecycle_1.0.4        spatstat.geom_3.2-7    lmtest_0.9-40
[121] GlobalOptions_0.1.2    RcppAnnoy_0.0.21       cowplot_1.1.2
[124] irlba_2.3.5.1          httpuv_1.6.13          R6_2.5.1
[127] promises_1.2.1         KernSmooth_2.23-22     gridExtra_2.3
[130] parallelly_1.36.0      codetools_0.2-19       assertthat_0.2.1
[133] fastDummies_1.7.3      MASS_7.3-60.0.1        withr_2.5.2
[136] SeuratObject_5.0.1     sctransform_0.4.1      rlist_0.4.6.2
[139] diptest_0.77-0         parallel_4.2.0         hms_1.1.3
[142] quadprog_1.5-8         grid_4.2.0             class_7.3-22
[145] carData_3.0-5          Rtsne_0.17             ggpubr_0.6.0
[148] spatstat.explore_3.2-5 ggforce_0.4.1          shiny_1.8.0
Command being timed: "Rscript /workdir/.pipen/Immunopipe/Immunarch/0/job.script"
User time (seconds): 118.40
System time (seconds): 7.29
Percent of CPU this job got: 129%
Elapsed (wall clock) time (h:mm:ss or m:ss): 1:36.96
Average shared text size (kbytes): 0
Average unshared data size (kbytes): 0
Average stack size (kbytes): 0
Average total size (kbytes): 0
Maximum resident set size (kbytes): 2211428
Average resident set size (kbytes): 0
Major (requiring I/O) page faults: 0
Minor (reclaiming a frame) page faults: 1142535
Voluntary context switches: 3278
Involuntary context switches: 2747830
Swaps: 0
File system inputs: 0
File system outputs: 0
Socket messages sent: 0
Socket messages received: 0
Signals delivered: 0
Page size (bytes): 4096
Exit status: 0
# CPU
Architecture:                    x86_64
CPU op-mode(s):                  32-bit, 64-bit
Byte Order:                      Little Endian
Address sizes:                   46 bits physical, 57 bits virtual
CPU(s):                          96
On-line CPU(s) list:             0-95
Thread(s) per core:              2
Core(s) per socket:              24
Socket(s):                       2
NUMA node(s):                    2
Vendor ID:                       GenuineIntel
CPU family:                      6
Model:                           106
Model name:                      Intel(R) Xeon(R) Gold 6342 CPU @ 2.80GHz
Stepping:                        6
CPU MHz:                         3373.130
CPU max MHz:                     3500.0000
CPU min MHz:                     800.0000
BogoMIPS:                        5600.00
Virtualization:                  VT-x
L1d cache:                       2.3 MiB
L1i cache:                       1.5 MiB
L2 cache:                        60 MiB
L3 cache:                        72 MiB
NUMA node0 CPU(s):               0,2,4,6,8,10,12,14,16,18,20,22,24,26,28,30,32,34,36,38,40,42,44,46,48,50,52,54,56,58,60,62,64,66,68,70,72,74,76,78,80,82,84,86,88,90,92,94
NUMA node1 CPU(s):               1,3,5,7,9,11,13,15,17,19,21,23,25,27,29,31,33,35,37,39,41,43,45,47,49,51,53,55,57,59,61,63,65,67,69,71,73,75,77,79,81,83,85,87,89,91,93,95
Vulnerability Itlb multihit:     Not affected
Vulnerability L1tf:              Not affected
Vulnerability Mds:               Not affected
Vulnerability Meltdown:          Not affected
Vulnerability Mmio stale data:   Mitigation; Clear CPU buffers; SMT vulnerable
Vulnerability Retbleed:          Not affected
Vulnerability Spec store bypass: Mitigation; Speculative Store Bypass disabled via prctl
Vulnerability Spectre v1:        Mitigation; usercopy/swapgs barriers and __user pointer sanitization
Vulnerability Spectre v2:        Mitigation; Enhanced IBRS, IBPB conditional, RSB filling, PBRSB-eIBRS SW sequence
Vulnerability Srbds:             Not affected
Vulnerability Tsx async abort:   Not affected
Flags:                           fpu vme de pse tsc msr pae mce cx8 apic sep mtrr pge mca cmov pat pse36 clflush dts acpi mmx fxsr sse sse2 ss ht tm pbe syscall nx pdpe1gb rdtscp lm constant_tsc art arch_perfmon pebs bts rep_good nopl xtopology nonstop_tsc cpuid aperfmperf pni pclmulqdq dtes64 monitor ds_cpl vmx smx est tm2 ssse3 sdbg fma cx16 xtpr pdcm pcid dca sse4_1 sse4_2 x2apic movbe popcnt tsc_deadline_timer aes xsave avx f16c rdrand lahf_lm abm 3dnowprefetch cpuid_fault epb cat_l3 invpcid_single intel_ppin ssbd mba ibrs ibpb stibp ibrs_enhanced tpr_shadow vnmi flexpriority ept vpid ept_ad fsgsbase tsc_adjust bmi1 avx2 smep bmi2 erms invpcid cqm rdt_a avx512f avx512dq rdseed adx smap avx512ifma clflushopt clwb intel_pt avx512cd sha_ni avx512bw avx512vl xsaveopt xsavec xgetbv1 xsaves cqm_llc cqm_occup_llc cqm_mbm_total cqm_mbm_local split_lock_detect wbnoinvd dtherm ida arat pln pts avx512vbmi umip pku ospke avx512_vbmi2 gfni vaes vpclmulqdq avx512_vnni avx512_bitalg tme avx512_vpopcntdq la57 rdpid fsrm md_clear pconfig flush_l1d arch_capabilities

# Memory
Memory block size:         2G
Total online memory:       1T
Total offline memory:      0B
Powered by
pipen v0.13.0
and
pipen-report v0.17.3